Using GitLab API to create a DORA metrics dashboard
Posted 16 May 2024 · 6 min read
Measuring software development team productivity is hard. Once you start measuring metrics and using them to judge performance you can start to influence behaviour in ways that can have an unintentional impact. Relying on representations of software delivery, such as project management tools like Jira, can incentivise behaviour that improves metrics without improving outcomes - such as inflating story point estimates or timing when to close tickets.
Inspired by a Pragmatic Engineer post about how many big tech companies track productivity, I looked to explore how we could move from basing productivity measures solely from metrics derived from Jira workflows to the reality of how we change and deploy our projects. Using the GitLab API I was able to create dashboards for our teams at Mintel to track deployment frequency and lead time for changes.
What to track?
The main metric we currently use for engineering productivity targets cycle time, that is the time it takes for a ticket to move through a Jira workflow from the 'In Progress' state to 'Done'. We already have this data at hand as all of our engineering teams use Jira and Jira's reporting tools allow for creating various reports to help track and visualise this data.
However these metrics are a representation of what's really happening, manually kept in sync (or not) with the actual code changes and releases. In 2020 the DevOps Research and Assessment (DORA) identified four key metrics that indicate the performance of a software development team:
- Deployment Frequency - How often an organization successfully releases to production
- Lead Time for Changes - The amount of time it takes a commit to get into production
- Change Failure Rate - The percentage of deployments causing a failure in production
- Time to Restore Service - How long it takes an organization to recover from a failure in production
Deployment frequency and lead time for changes stood out to me as metrics we could derive from our code-based workflows fairly easily that could give an indicator of productivity.
Deployment frequency
The first step in figuring out deployment frequency was to find something I could use to indicate when a deployment was triggered. GitLab has a deployments feature that integrates with pre-built DORA metric dashboards. Job done!
Except our projects weren't using the deployments feature. I wanted to be able to get some useful data right away rather than force teams to take on extra work.
Most of our projects do use shared GitLab CI templates with a common workflow of pushing a tag to the main branch to trigger a deployment. These tags matched a common SemVer pattern (vX.X.X) and there's a GitLab API for fetching all the tags for a project.
I wrote a simple script in TypeScript to pull tags for each project owned by a team:
import { Gitlab } from "@gitbeaker/rest";

const api = new Gitlab({
  token: process.env.GITLAB_TOKEN,
});

const { id, name } = project;

const tags = await api.Tags.all(id);

// Filter to just release tags
const releaseTags = tags.filter((tag) => tag.name.match(/^v\d+\.\d+\.\d+$/));
I used gitbeaker to make the GitLab API requests, a easy to use GitLab SDK. I then used csv-stringify to write the releases to a CSV file.
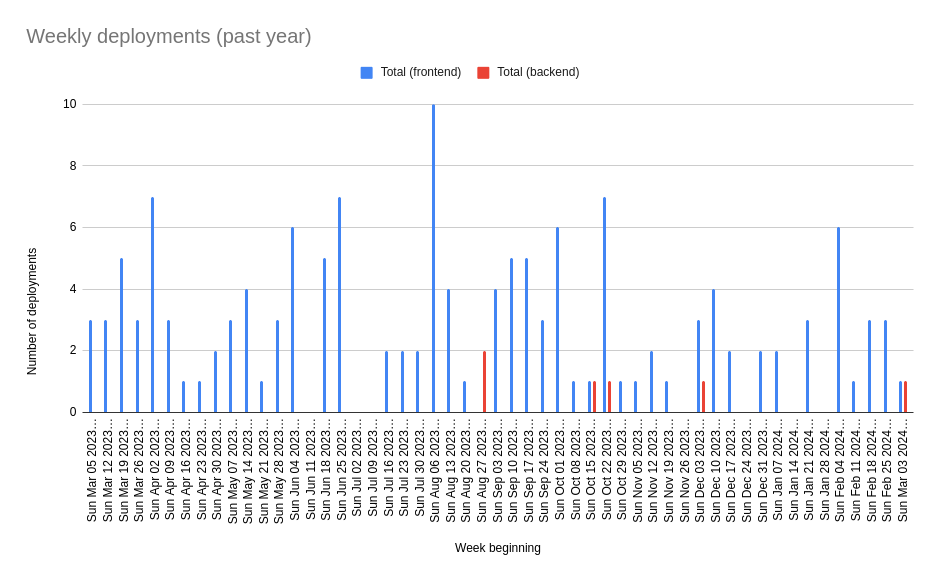
From there I was able to import the CSV data into a Google Sheet and generate some visualisations:

This approach doesn't account for the time taken for the deployment pipeline to complete or whether the deployment was successful, but was a good enough start for us to get an idea of deployment frequency.
Lead time for changes
Calculating lead time for changes was a little bit more involved. Lead time for changes is the time it takes for a change to be deployed to production after being committed to the main branch. Across our projects we merge changes to main through merge requests, and there's a GitLab API for fetching merge requests for a project.
I calculated lead time for changes for each merged change as:
Lead time = Time of release - Time of merge
This required associating each merge request with the release it was released in. I did this by taking each merge request and finding the earliest release of the project that happened after the merged_at time:
import moment from "moment";

const { id, name } = project;

// Get all merged merge requests in descending time order
const merges = await api.MergeRequests.all({
  projectId: id,
  state: "merged",
  sort: "desc",
});
// Get all releases in ascending time order
const tags = await api.Tags.all(id, {
  orderBy: "updated",
  sort: "asc",
});
const releaseTags = tags.filter((tag) => tag.name.match(/^v\d+\.\d+\.\d+$/));

const leadTimes = [];

merges.forEach((merge) => {
  if (merge.merged_at) {
    // Find the next release
    const mergeTime = moment(merge.merged_at);
    const release = releaseTags.find((tag) => {
      return moment(tag.commit.committed_date).utc().isAfter(mergeTime);
    });
    if (release && release.commit.committed_date) {
      // Get the time (in hours) between merge and release
      const leadTime = moment
        .duration(moment(release.commit.comitted_date).utc().diff(mergeTime))
        .asHours();
      leadTimes.push({
        project: name,
        title: merge.title,
        merged_at: merge.merged_at,
        released_at: release.commit.committed_date,
        lead_time: leadTime,
      });
    }
  }
});
From there I created another CSV file with the lead time for each change and was able to calculate average lead time for changes over a period of time.
A regularly updating dashboard
I shared the data with some of our Engineering Managers and there were some useful insights in the historical data, but we saw value in being able to incorporate these metrics into sprint retrospectives and regularly review changes over time. I didn't want to be on the hook for manually running these scripts and generating visualisations from CSV data, and I also wanted to get something working quickly without needing to deploy a full service/database.
I settled on throwing together a quick React dashboard using Vite, TypeScript and shadcn/ui. I converted my scripts to write the GitLab JSON response to files in the public directory so I could fetch the data once at build time and calculate metrics client-side on the dashboard. Associating changes with releases and calculating lead time takes a while, so I kept that in the build-time scripts.
I then set up a scheduled GitLab pipeline to pull fresh data and re-build the site each day, deploying using GitLab pages.
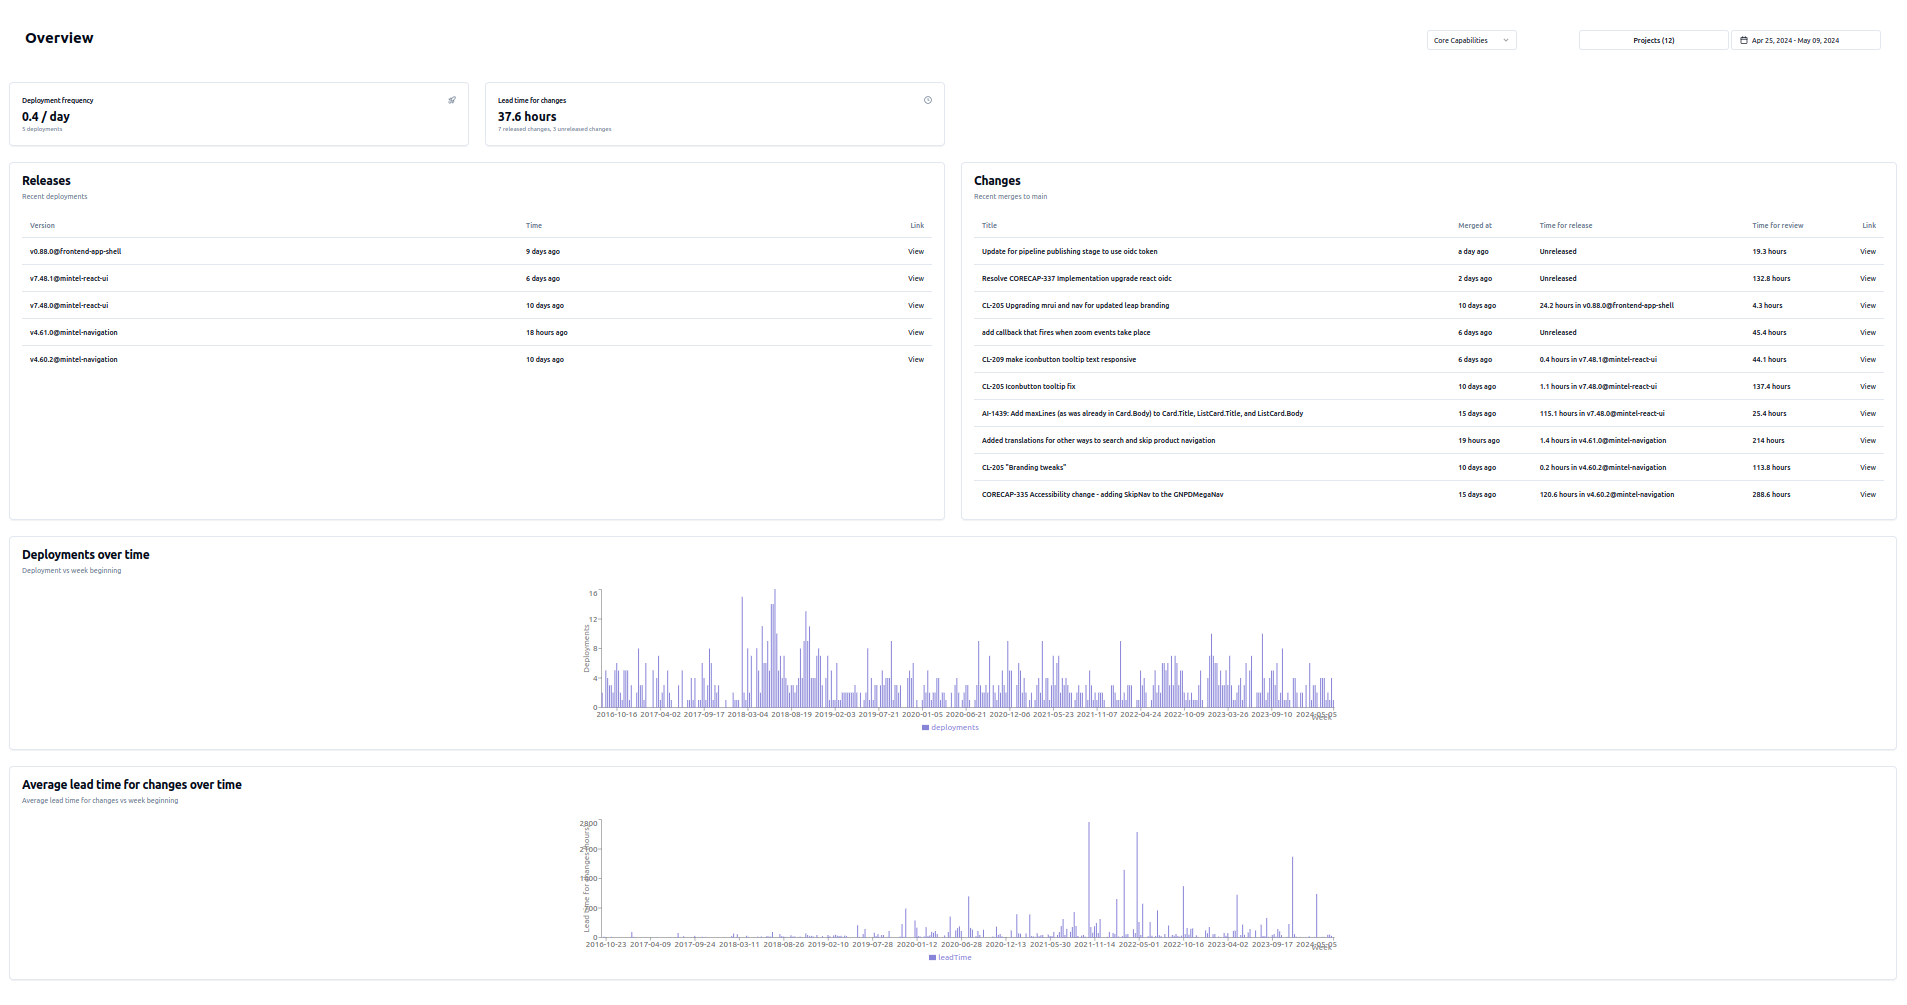
Quite quickly I was able to get a dashboard that would show these metrics that team leads could use:

How we're using it & future improvements
As it stands we've rolled this dashboard out across 4 different engineering teams and we're figuring out how it can be a useful tool for team self-reflection. It's starting to provide a more objective basis for discussions about the way teams work and evaluating the impact of changes.
My hope is for this to also provide another tool for communicating with stakeholders outside the team and demonstrating the impact developer experience improvements can have on productivity.
We're continuing to onboard more teams and getting a better understanding of how best to use these metrics as well as whether there are other metrics that would provide insight. In the longer term this custom solution isn't particularly scaleable or maintainable. If it proves valuable we'll be exploring platforms we could use to provide us similar dashboards such as GitLab deployments, DX or Atlassian Compass.
Quantifiable data also isn't everything - we are planning to run a department wide developer satisfaction survey to better understand how productive engineers feel with their current tooling and processes.
